The World Cup, through Social Data
Promoting the value of social data by investigating and presenting the social reaction from the matches of the world cup
FIFA World Cup, Russia
The World Cup was upon us, and with the recent feature launch of emoji clouds within the Brandwatch platform, it was a great opportunity to show off the power of social listening.
After some initial research, I facilitated a workshop to crowdsource ideas bringing together a diverse group of people and disciplines.
1
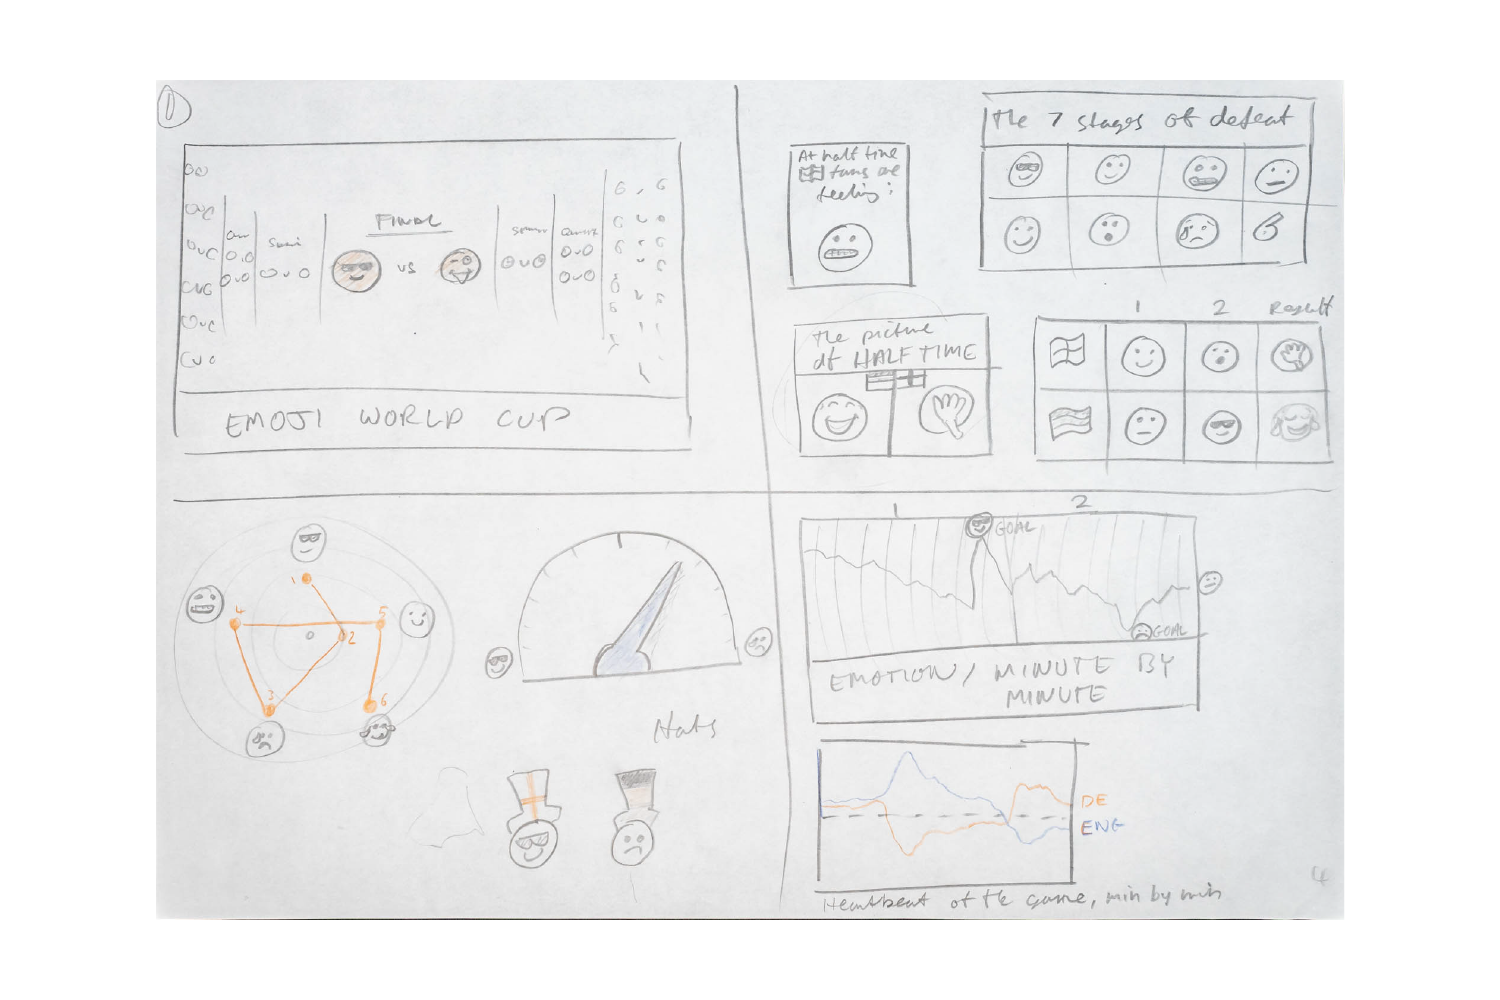
Using index cards we noted down any and all data points of a match for example, no. of goals, red cards, celebratory dances etc. The second part was jotting down all the ways we can analyse data through Brandwatch Analytics. 2
Condensing each set into the component themes and topics, we then blindly paired up a card from each set. Each member of the team then picked out a pairing, and had 10 minutes to come up with as many ideas around this, before presenting back to the group.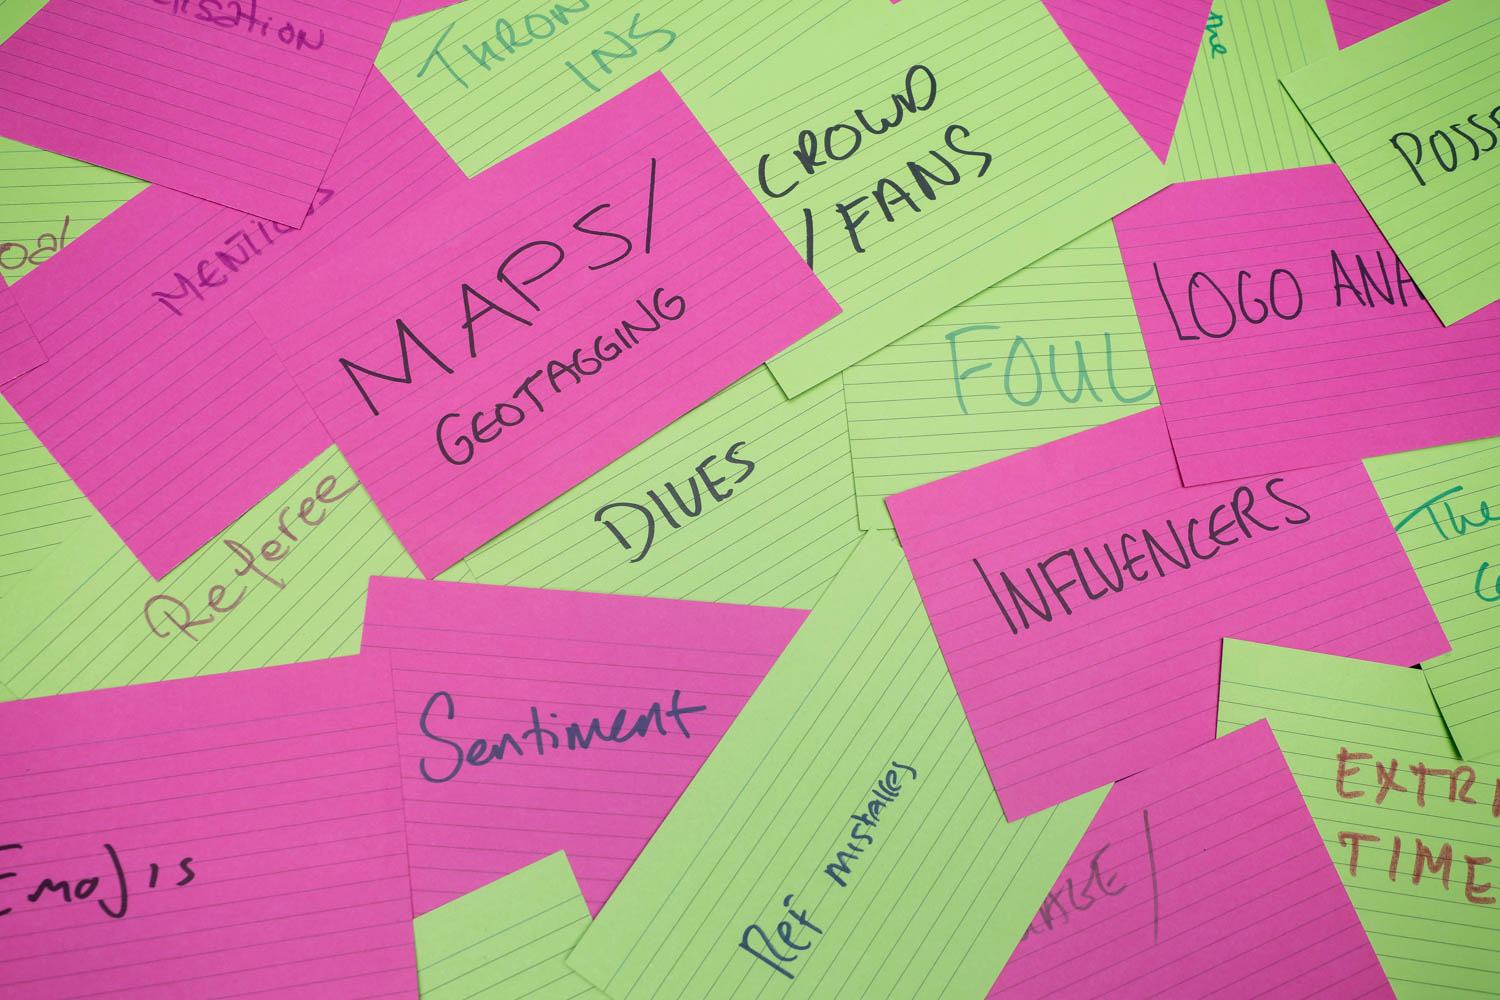
Refining the idea
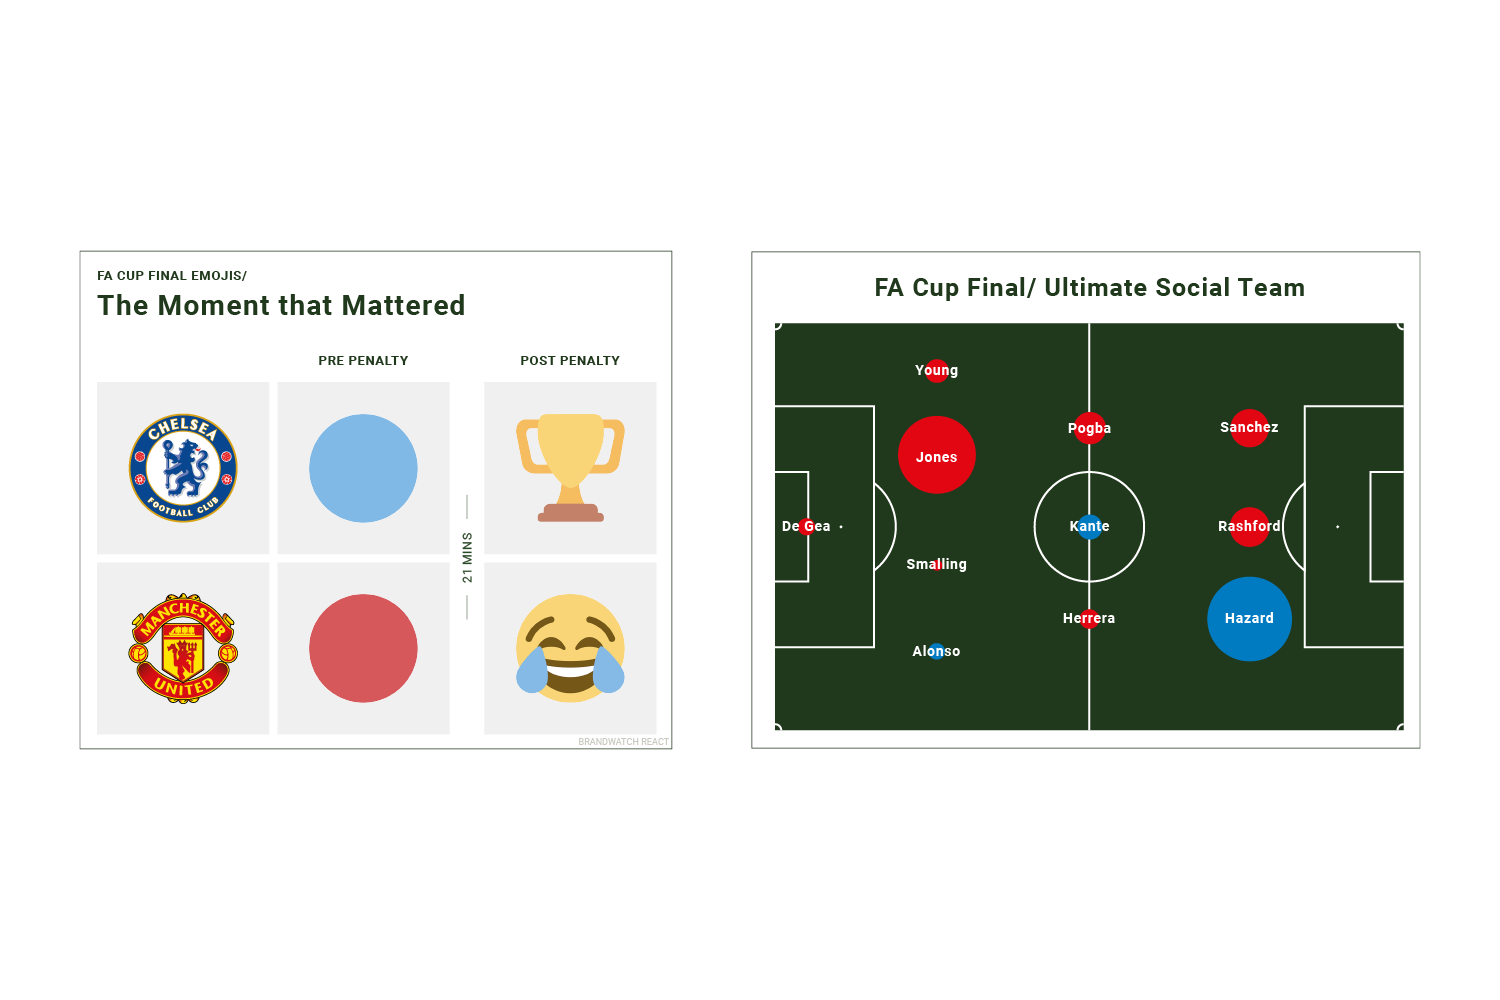
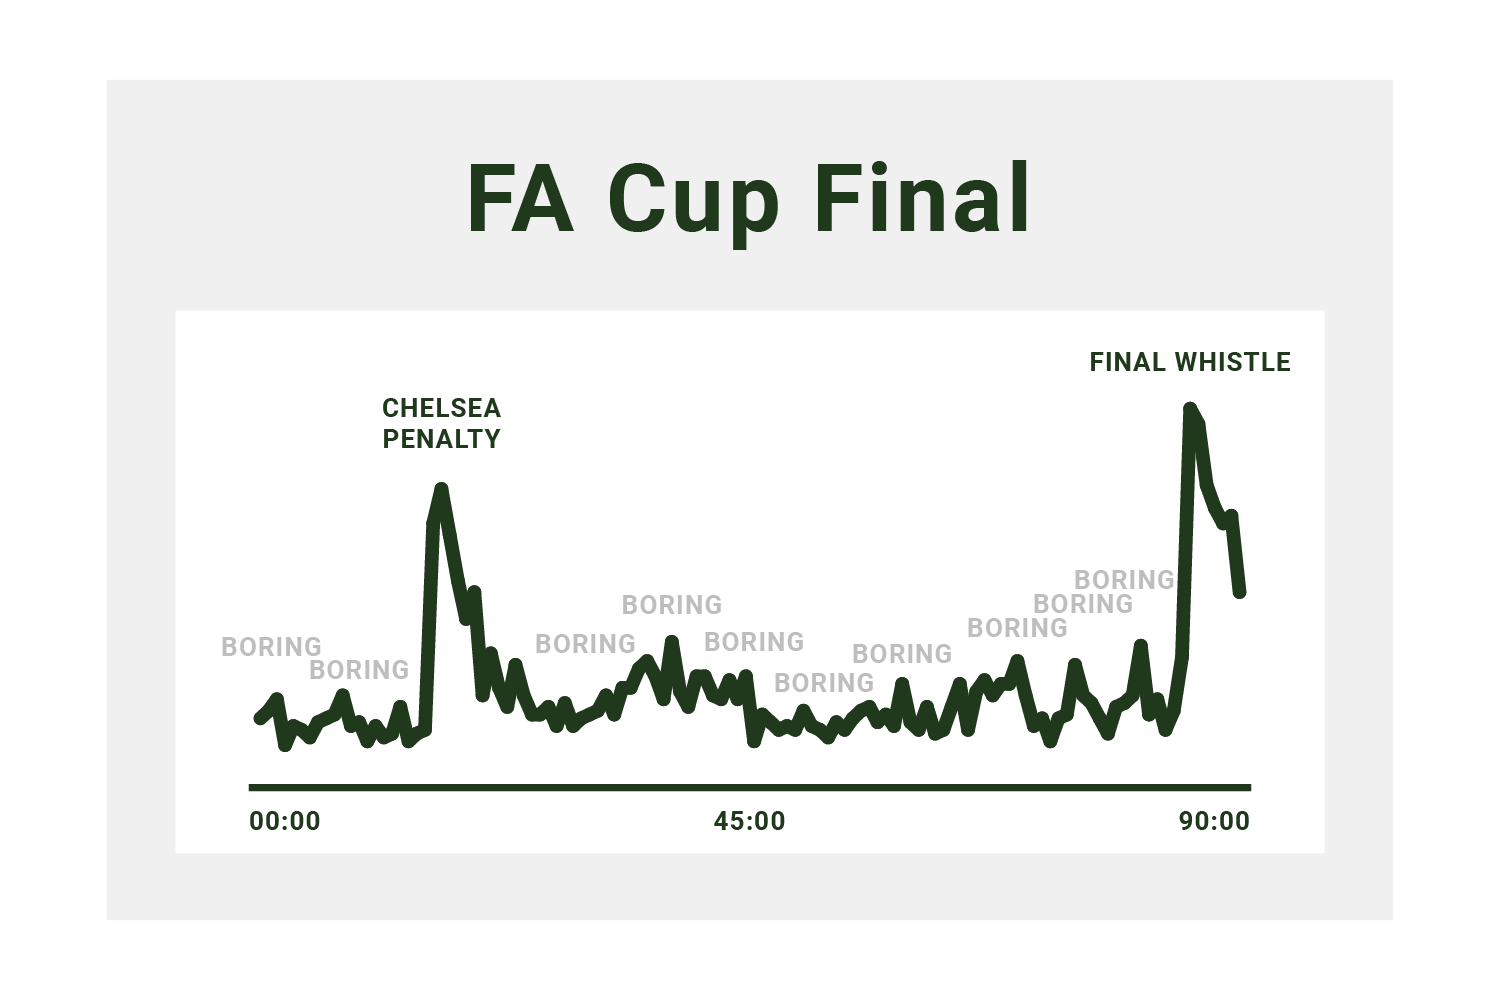
Building on ideas from the workshop I developed a few different approaches we could take. With the FA Cup final just round the corner, we had the perfect opportunity to test our ideas using real data.
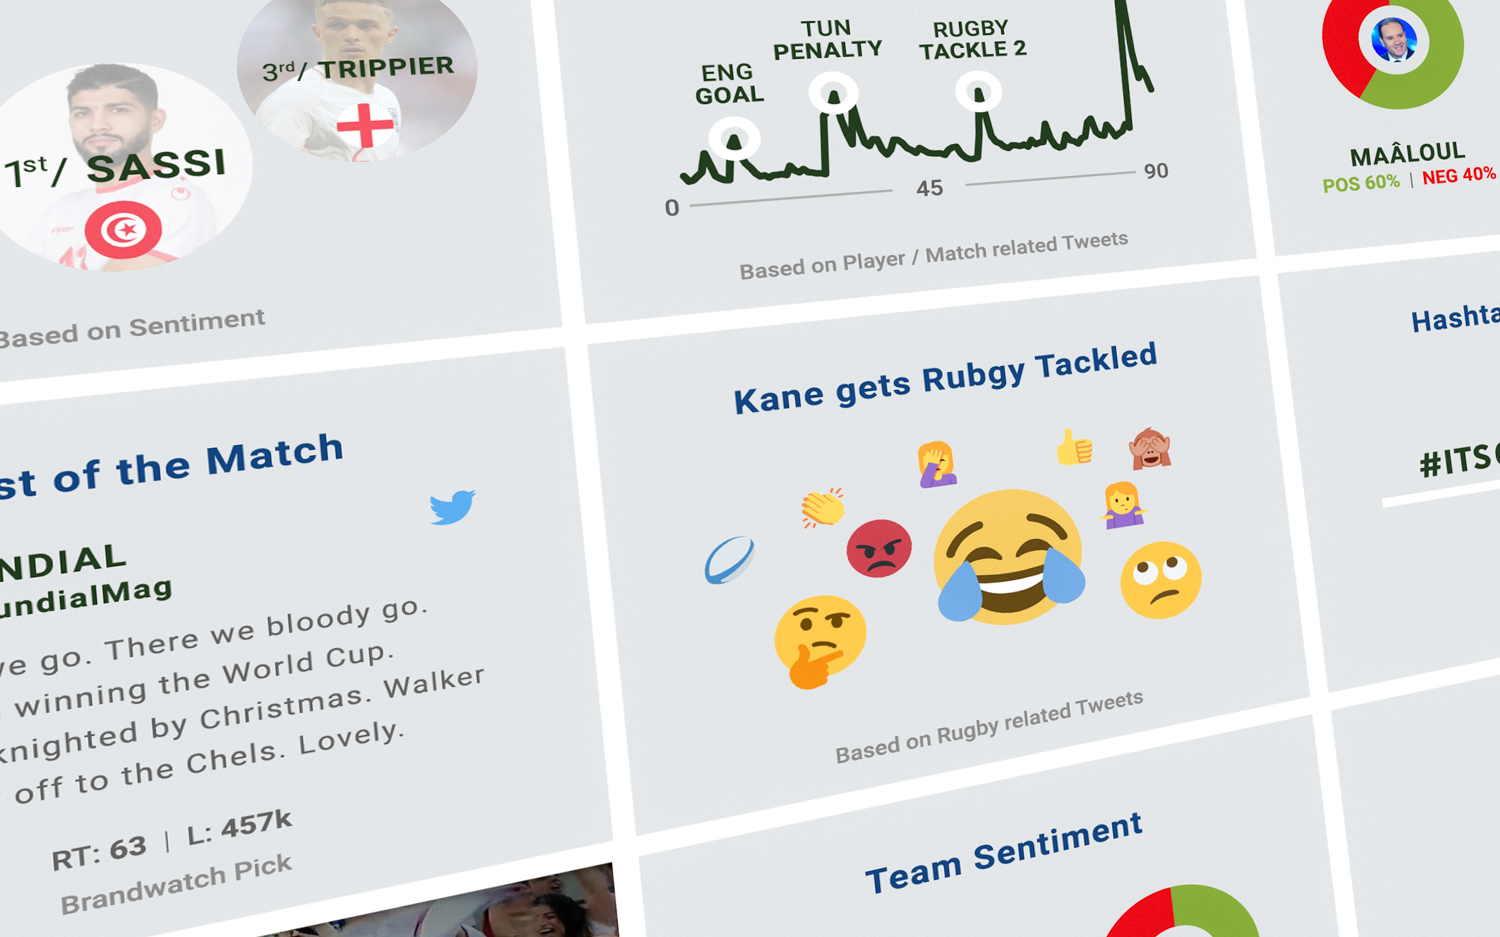
This reinforced the (well known) unpredictability of football matches and thus, the subsequent resulting data. We decided to run with the idea of a ‘Social Post Match Analysis’ that would give us the flexibility to highlight the different key moments of a game.
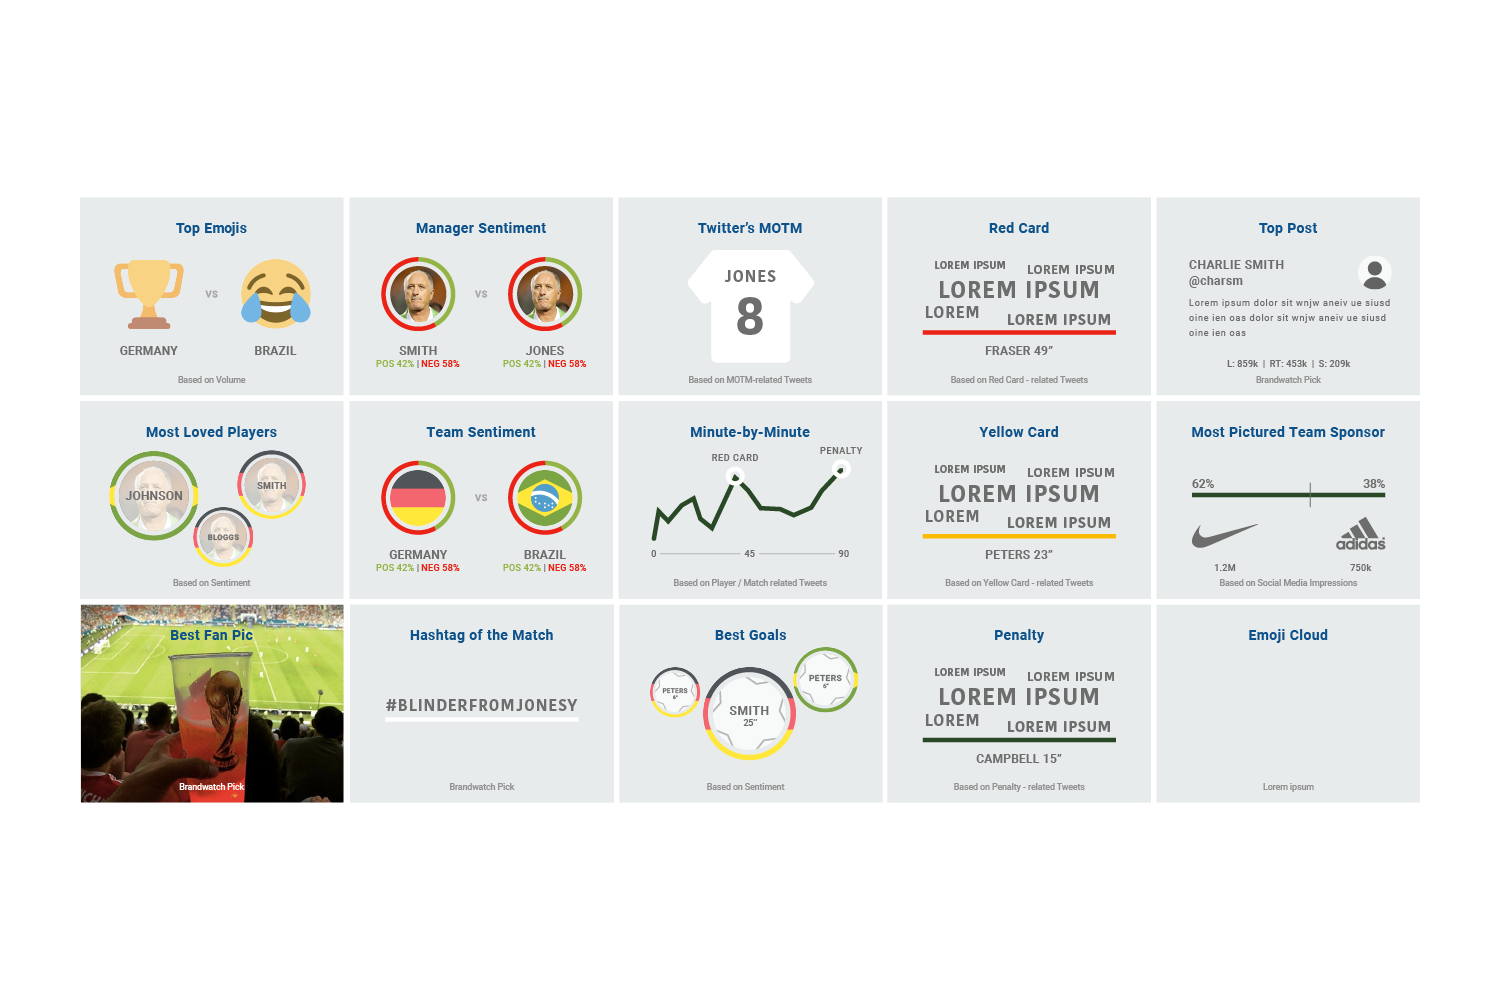
Another challenge that cropped up was having no developer resource for this project. Taking this on board, I designed a dynamic grid system with different cards that would allow us to easily adapt the infographic depending on the events of the game.
Result
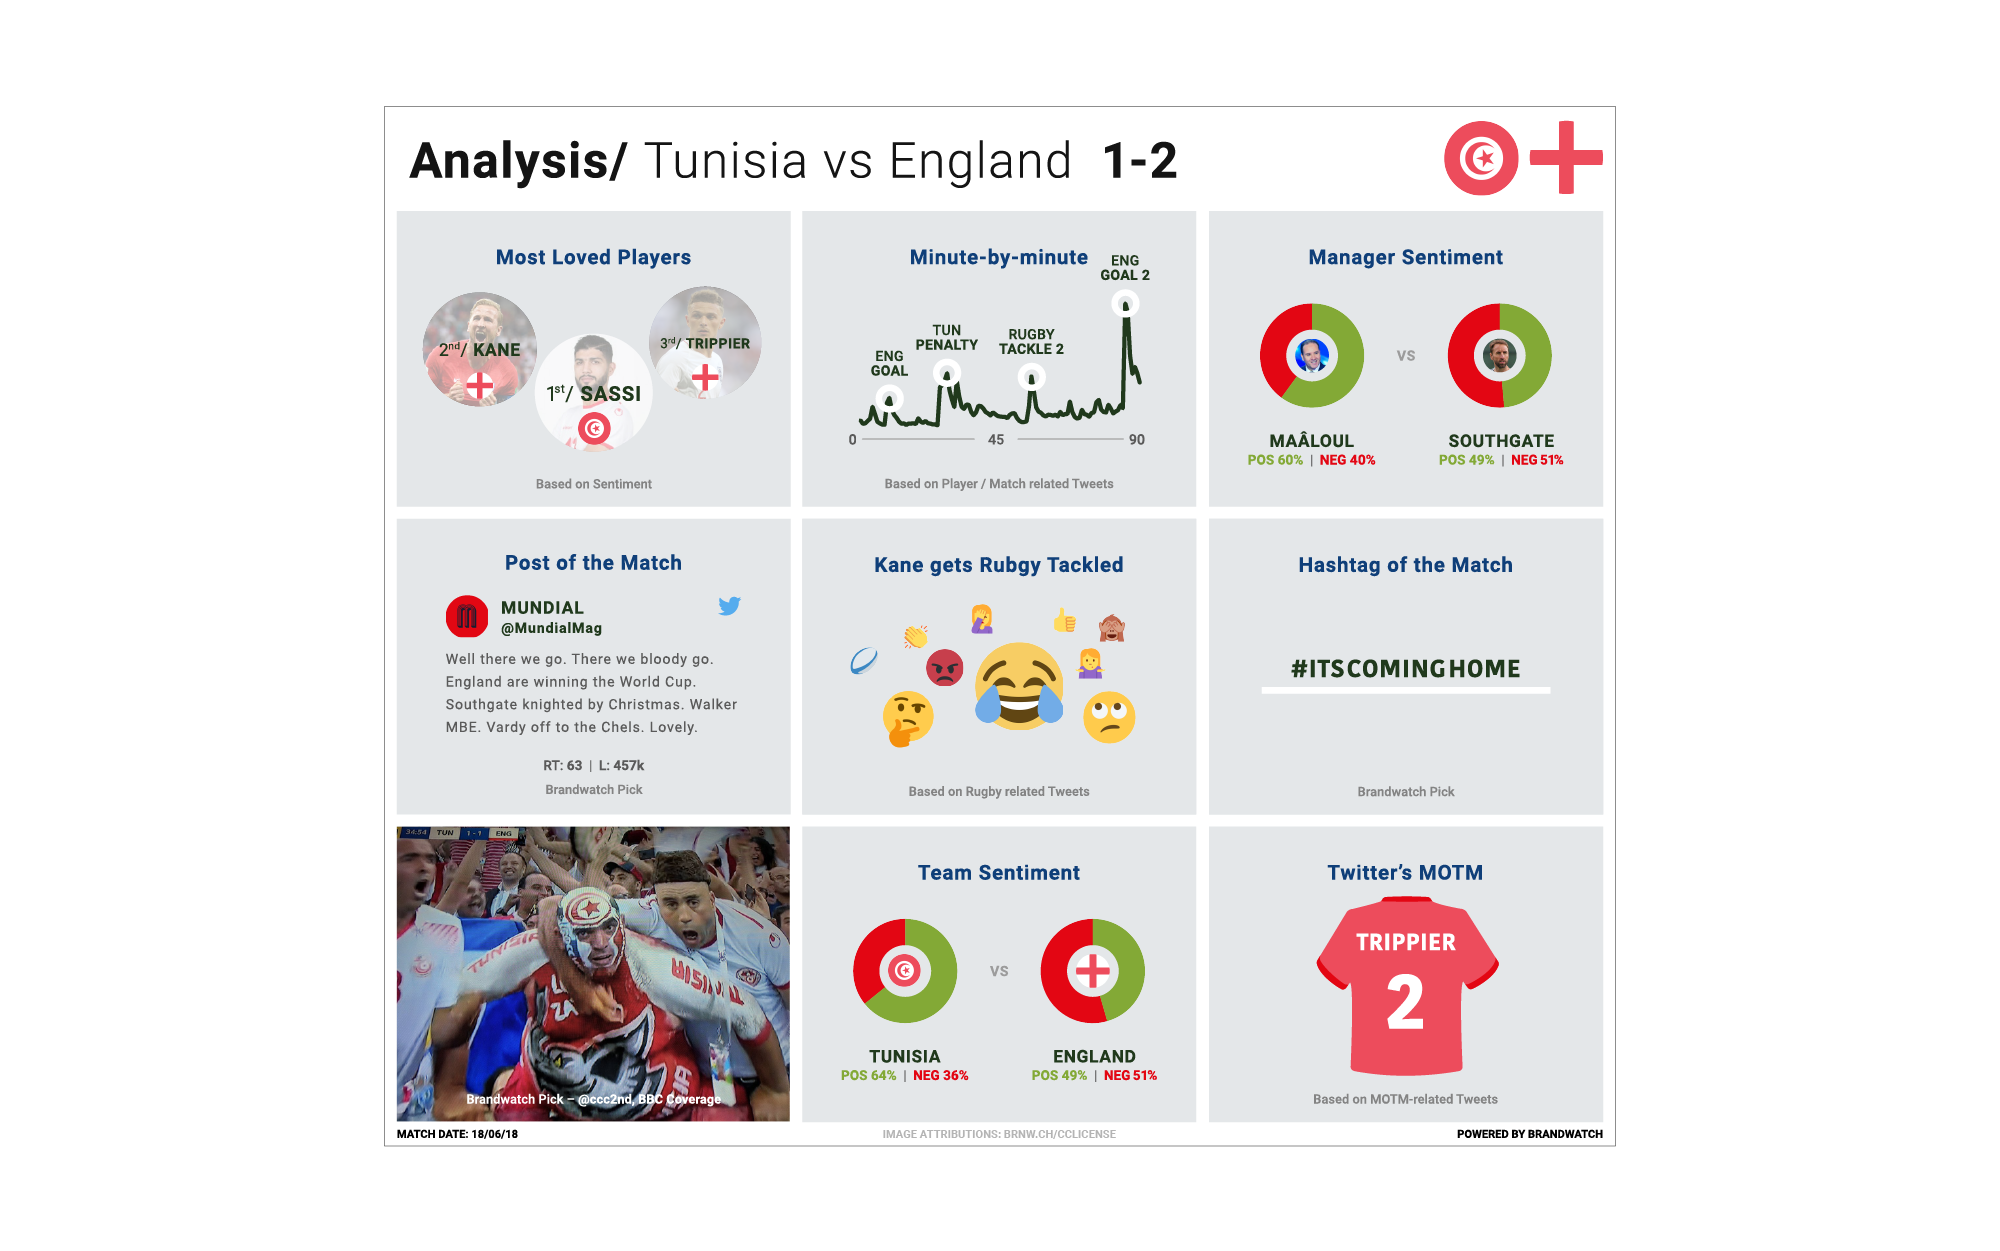
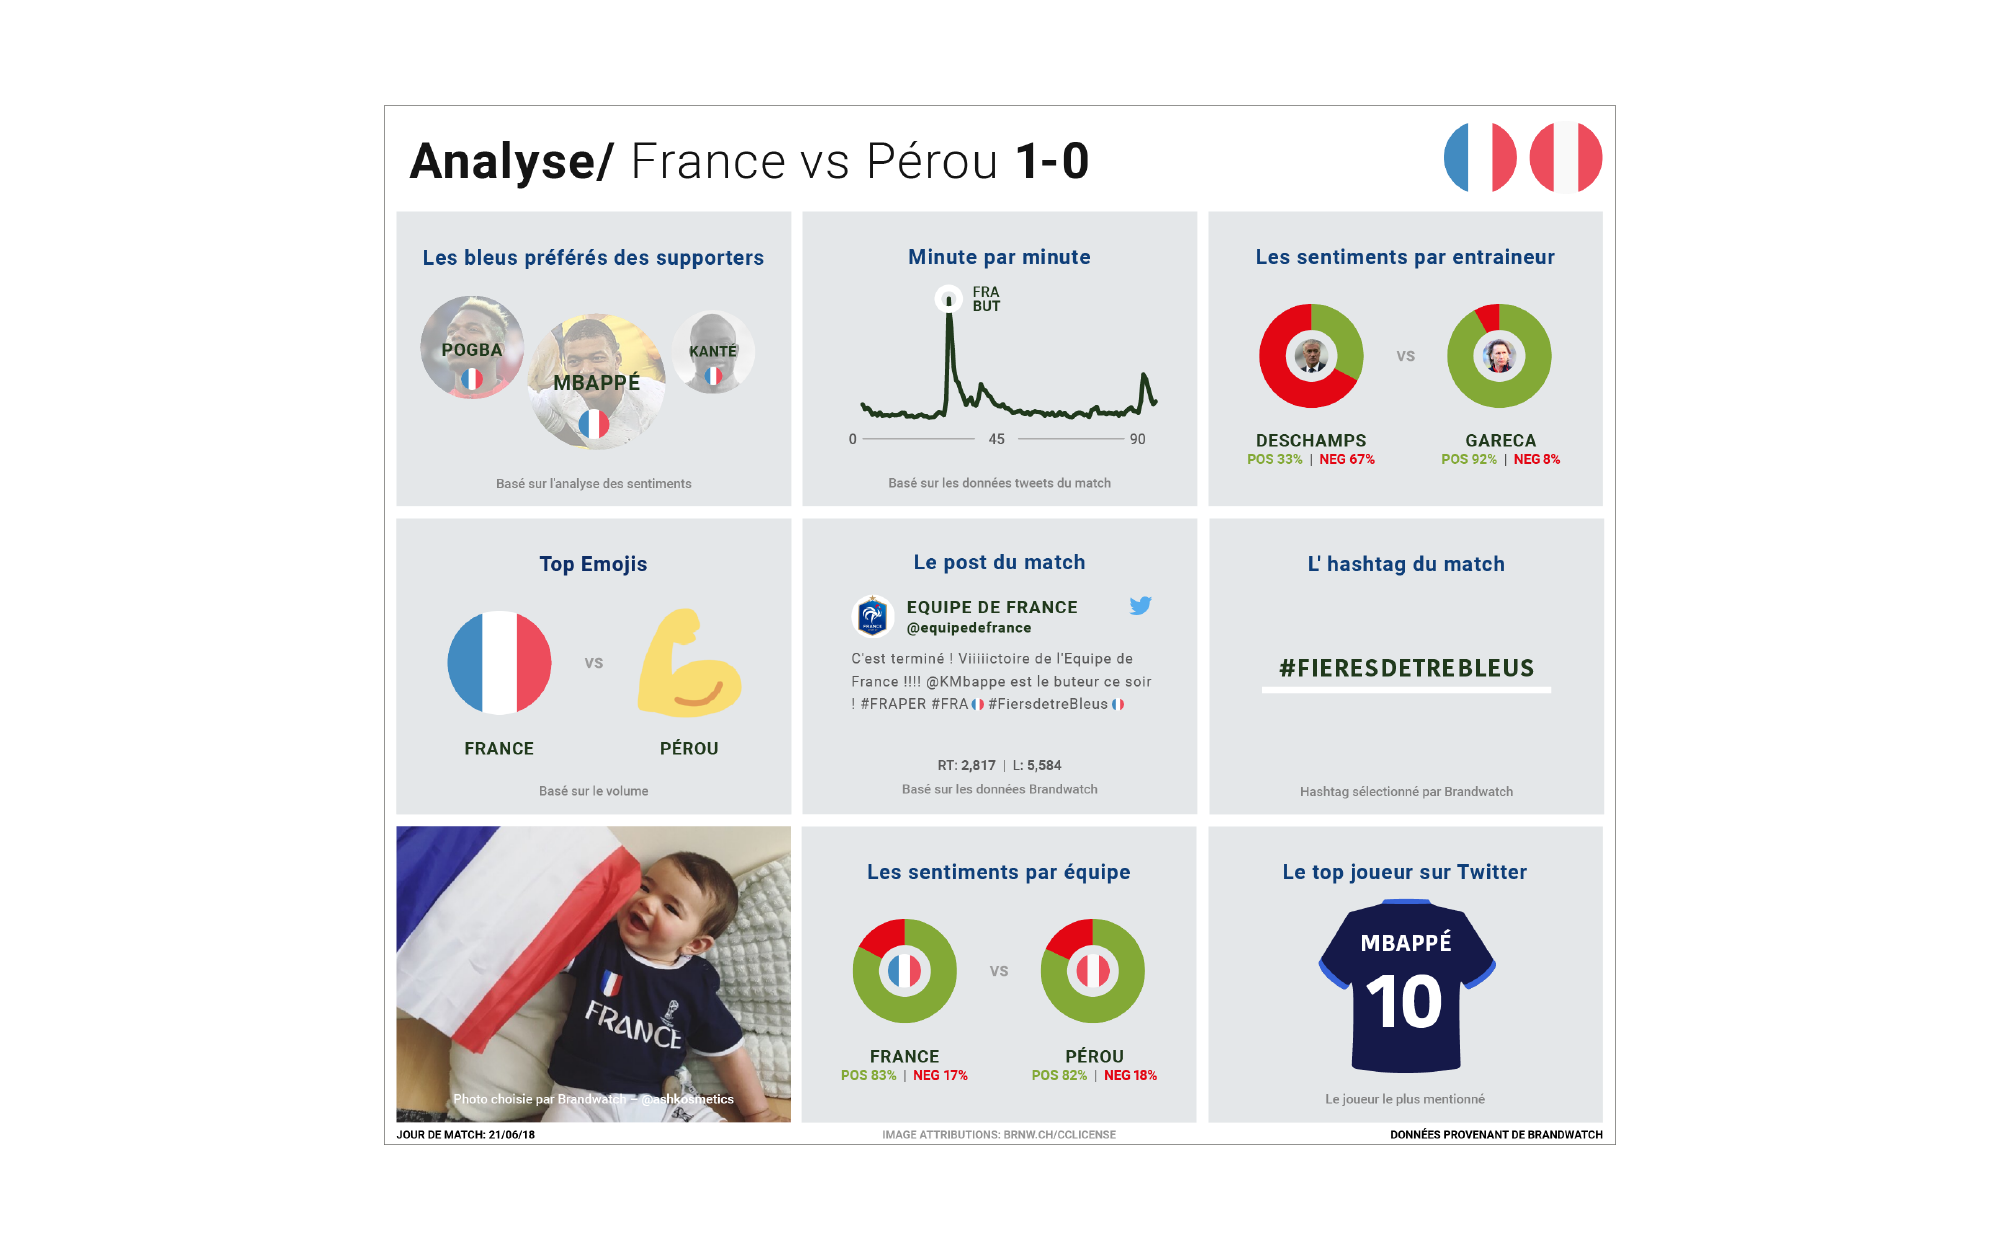
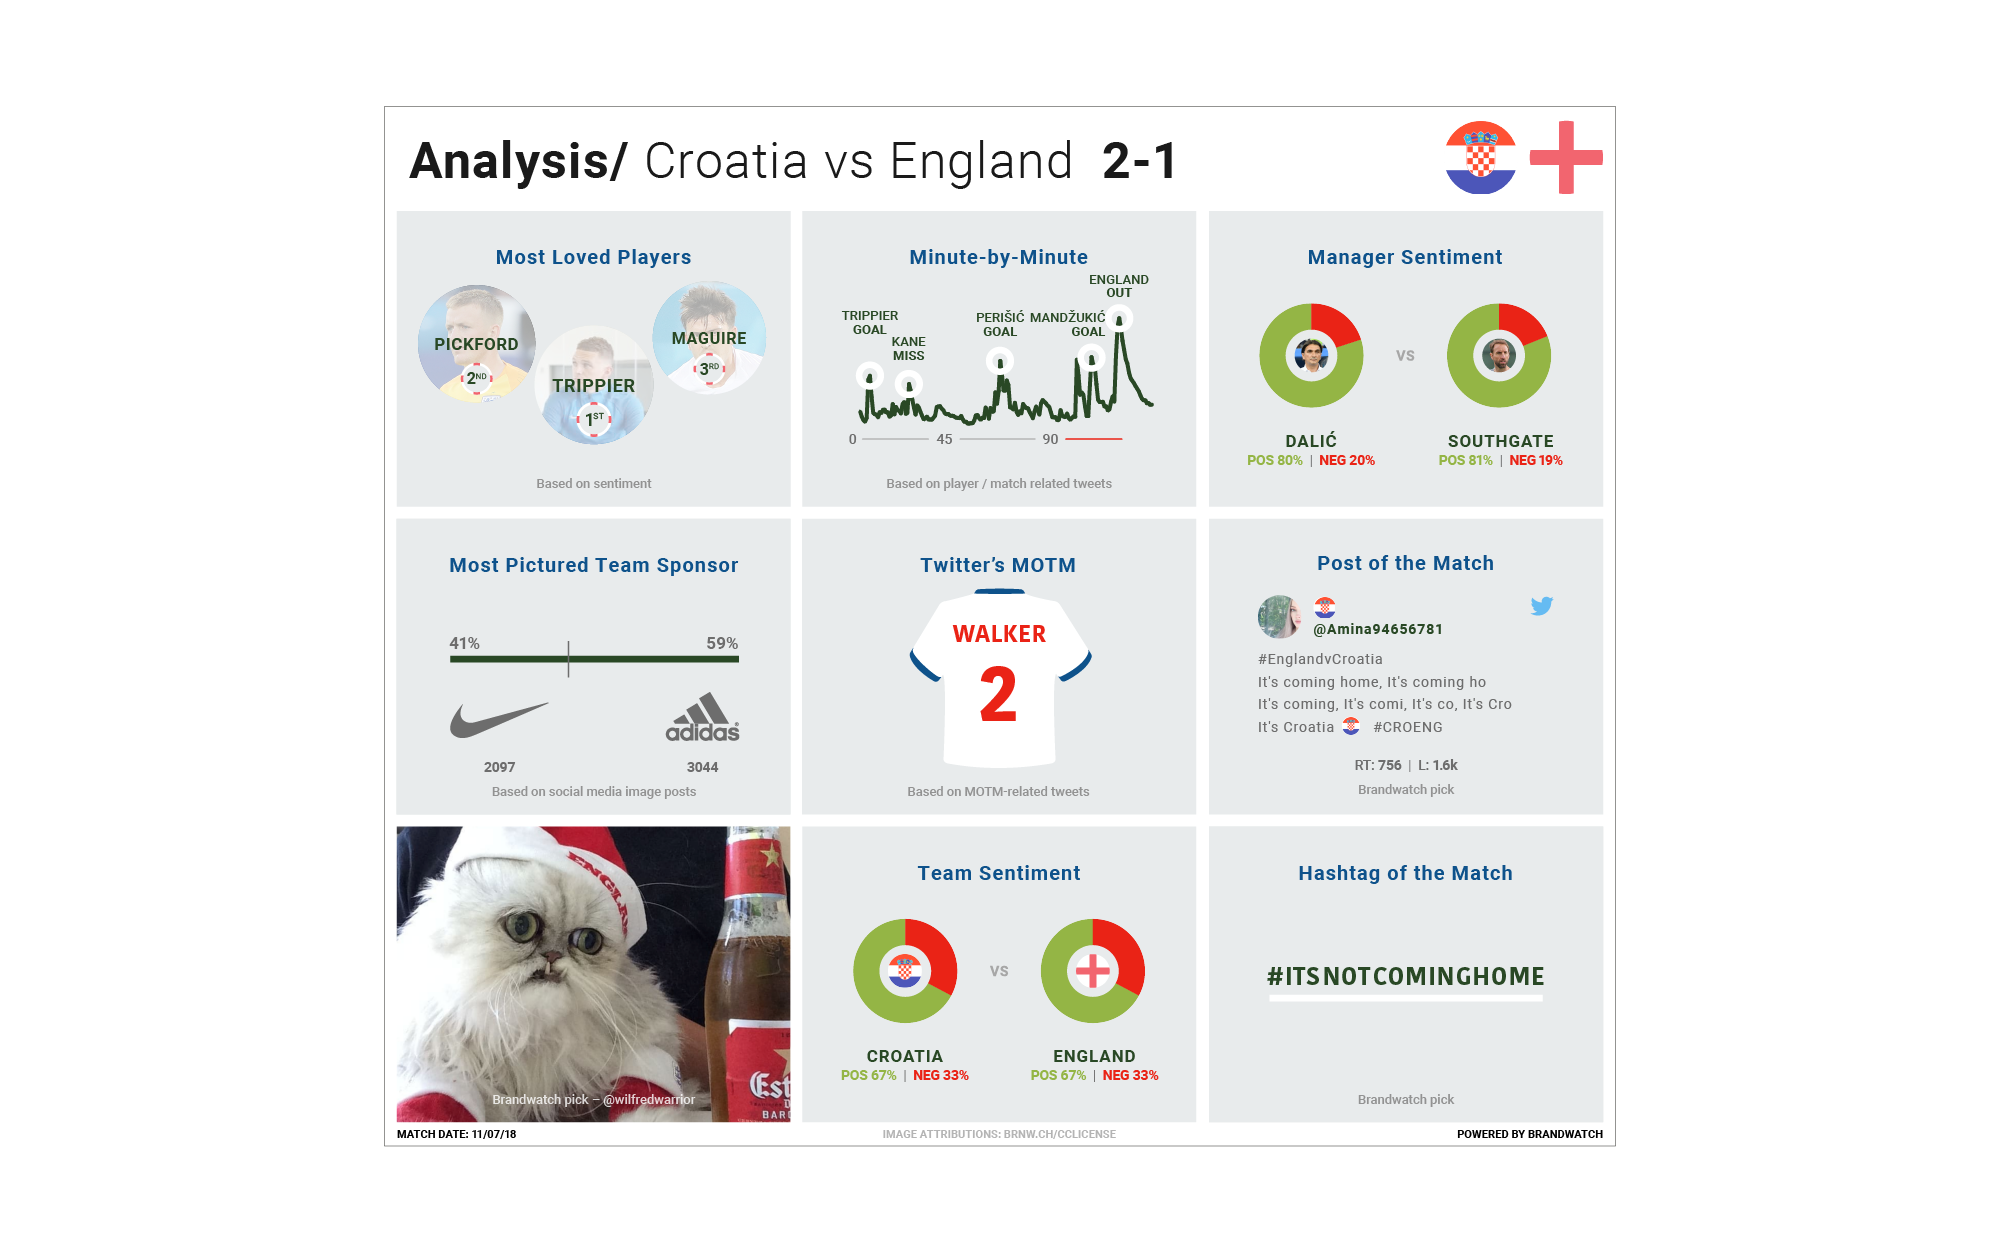
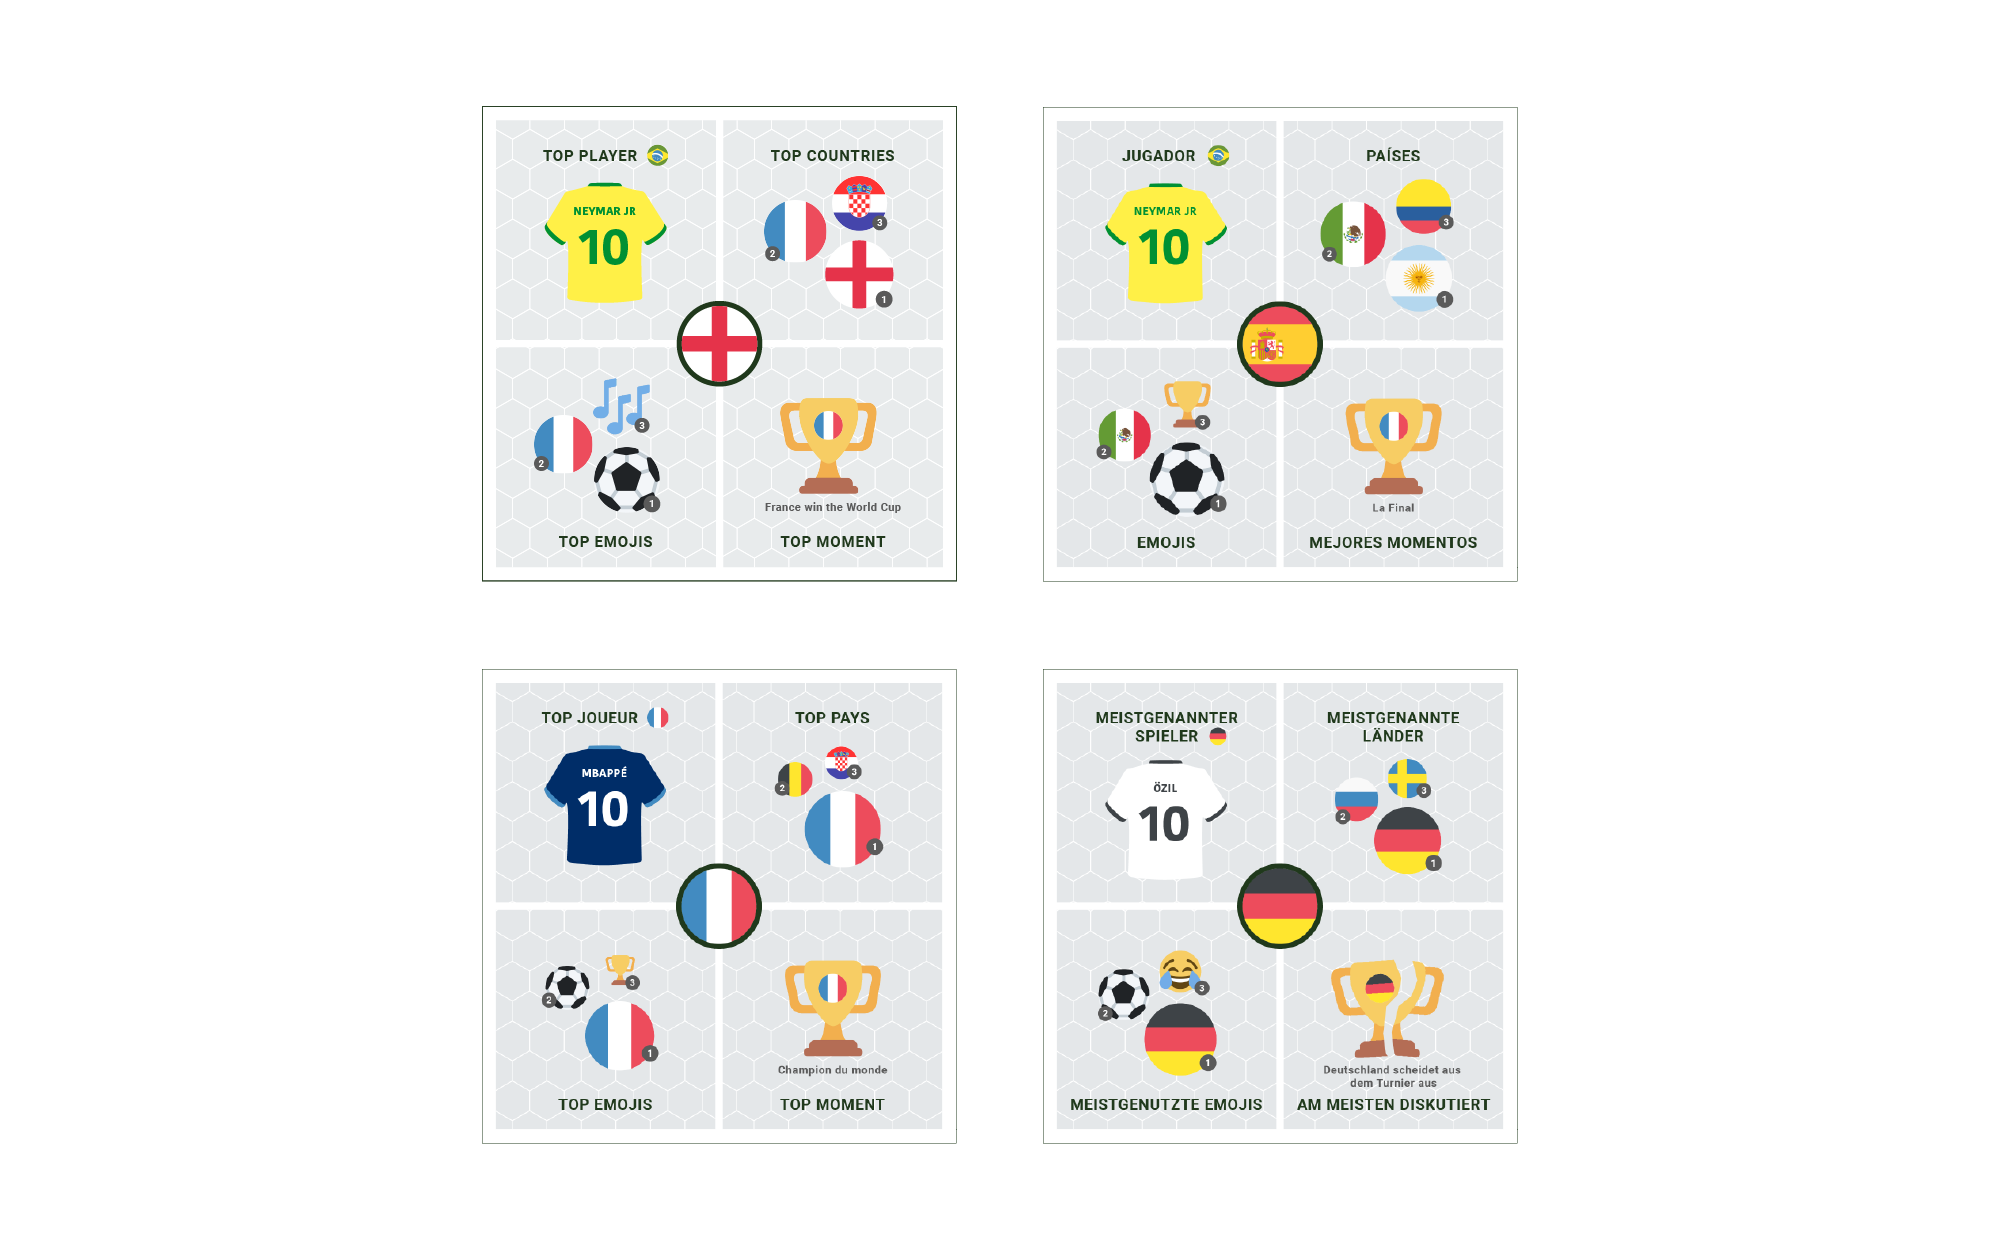
Focusing on the teams from our office locations - namely England, Spain & France (Germany😢), we covered a variety of games, which were posted on social and our blog alongside commentary and analysis.
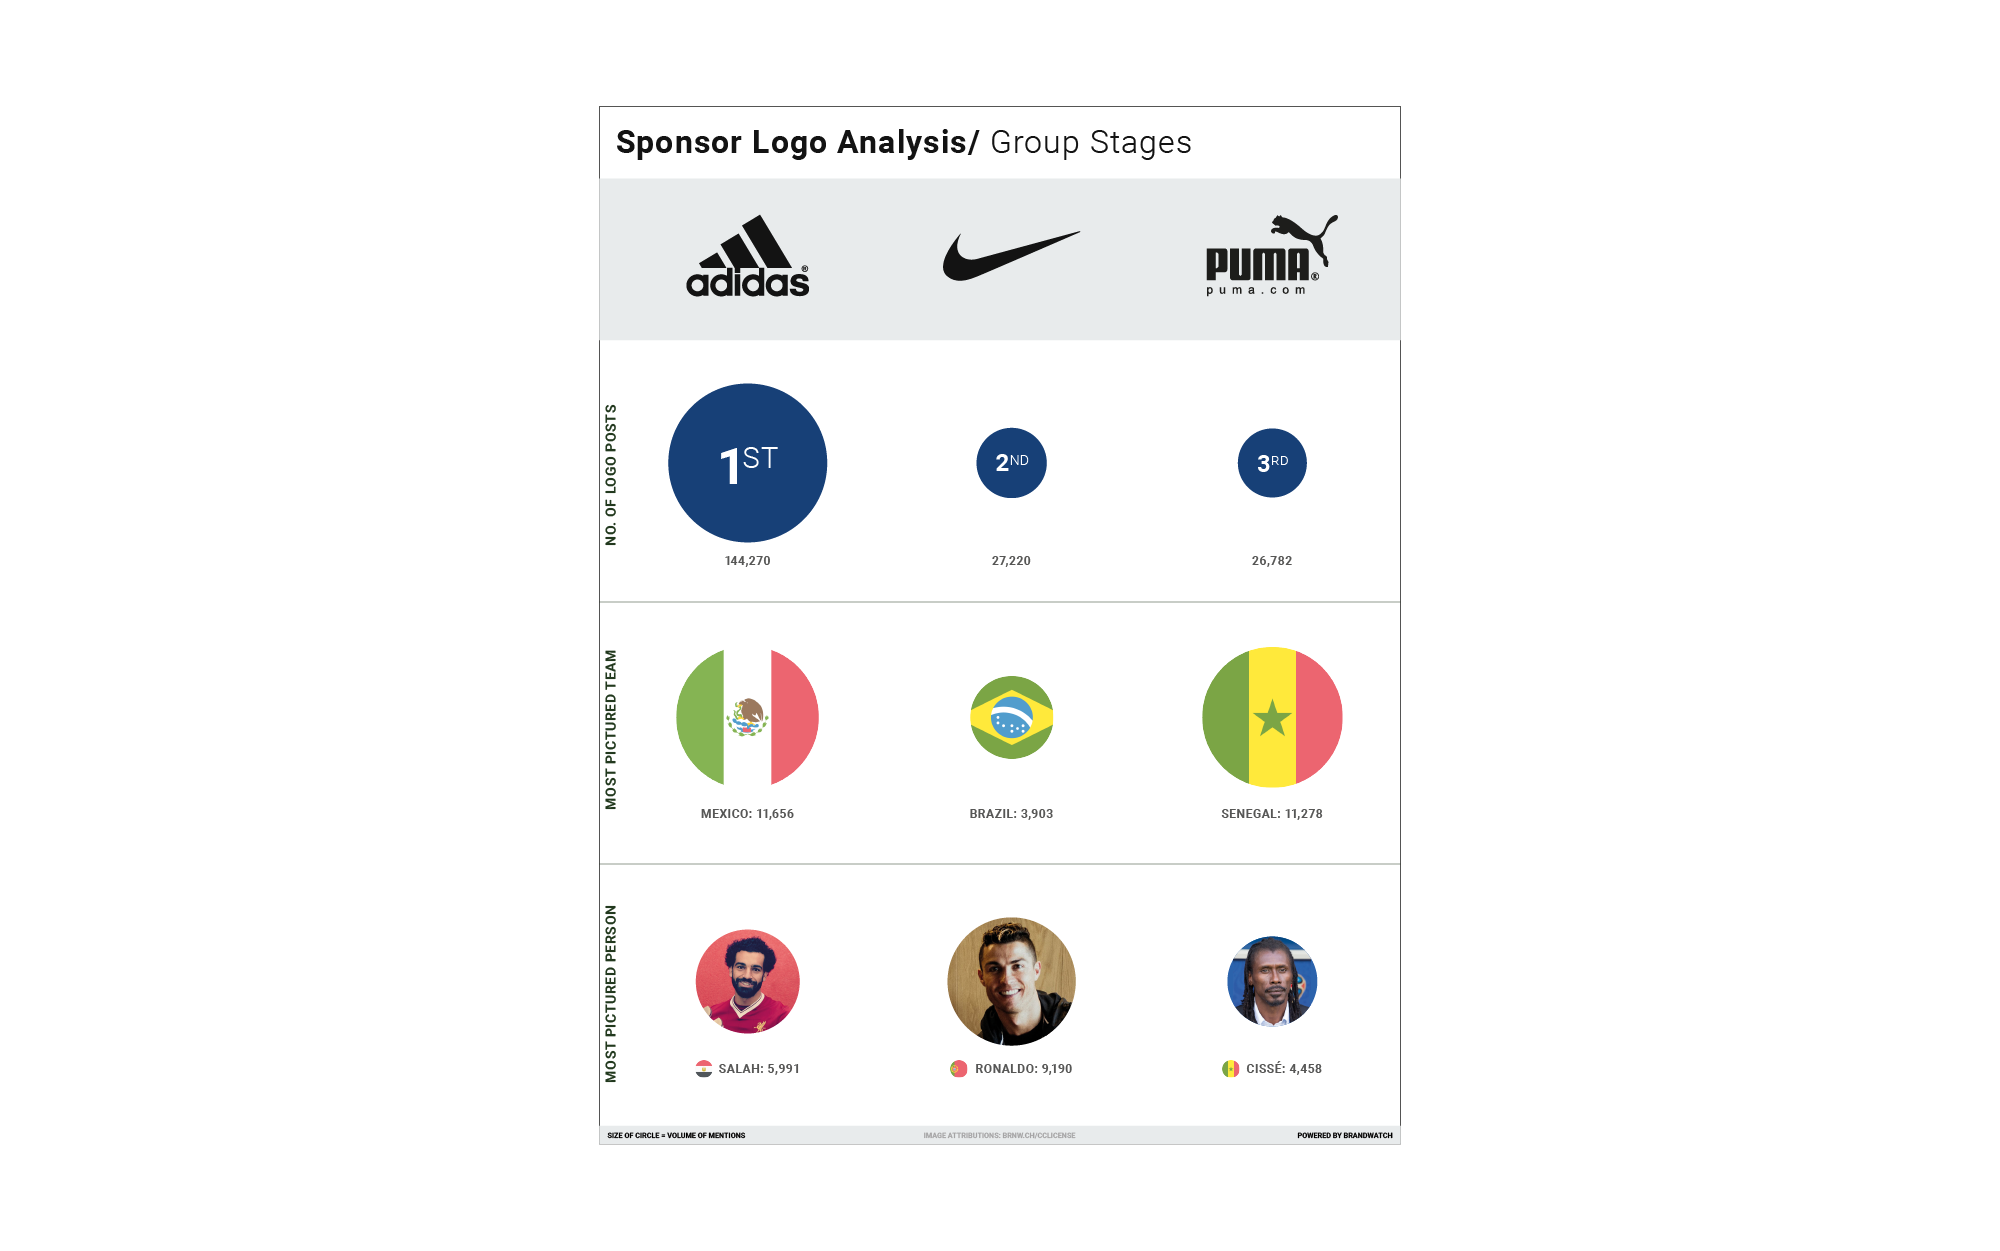
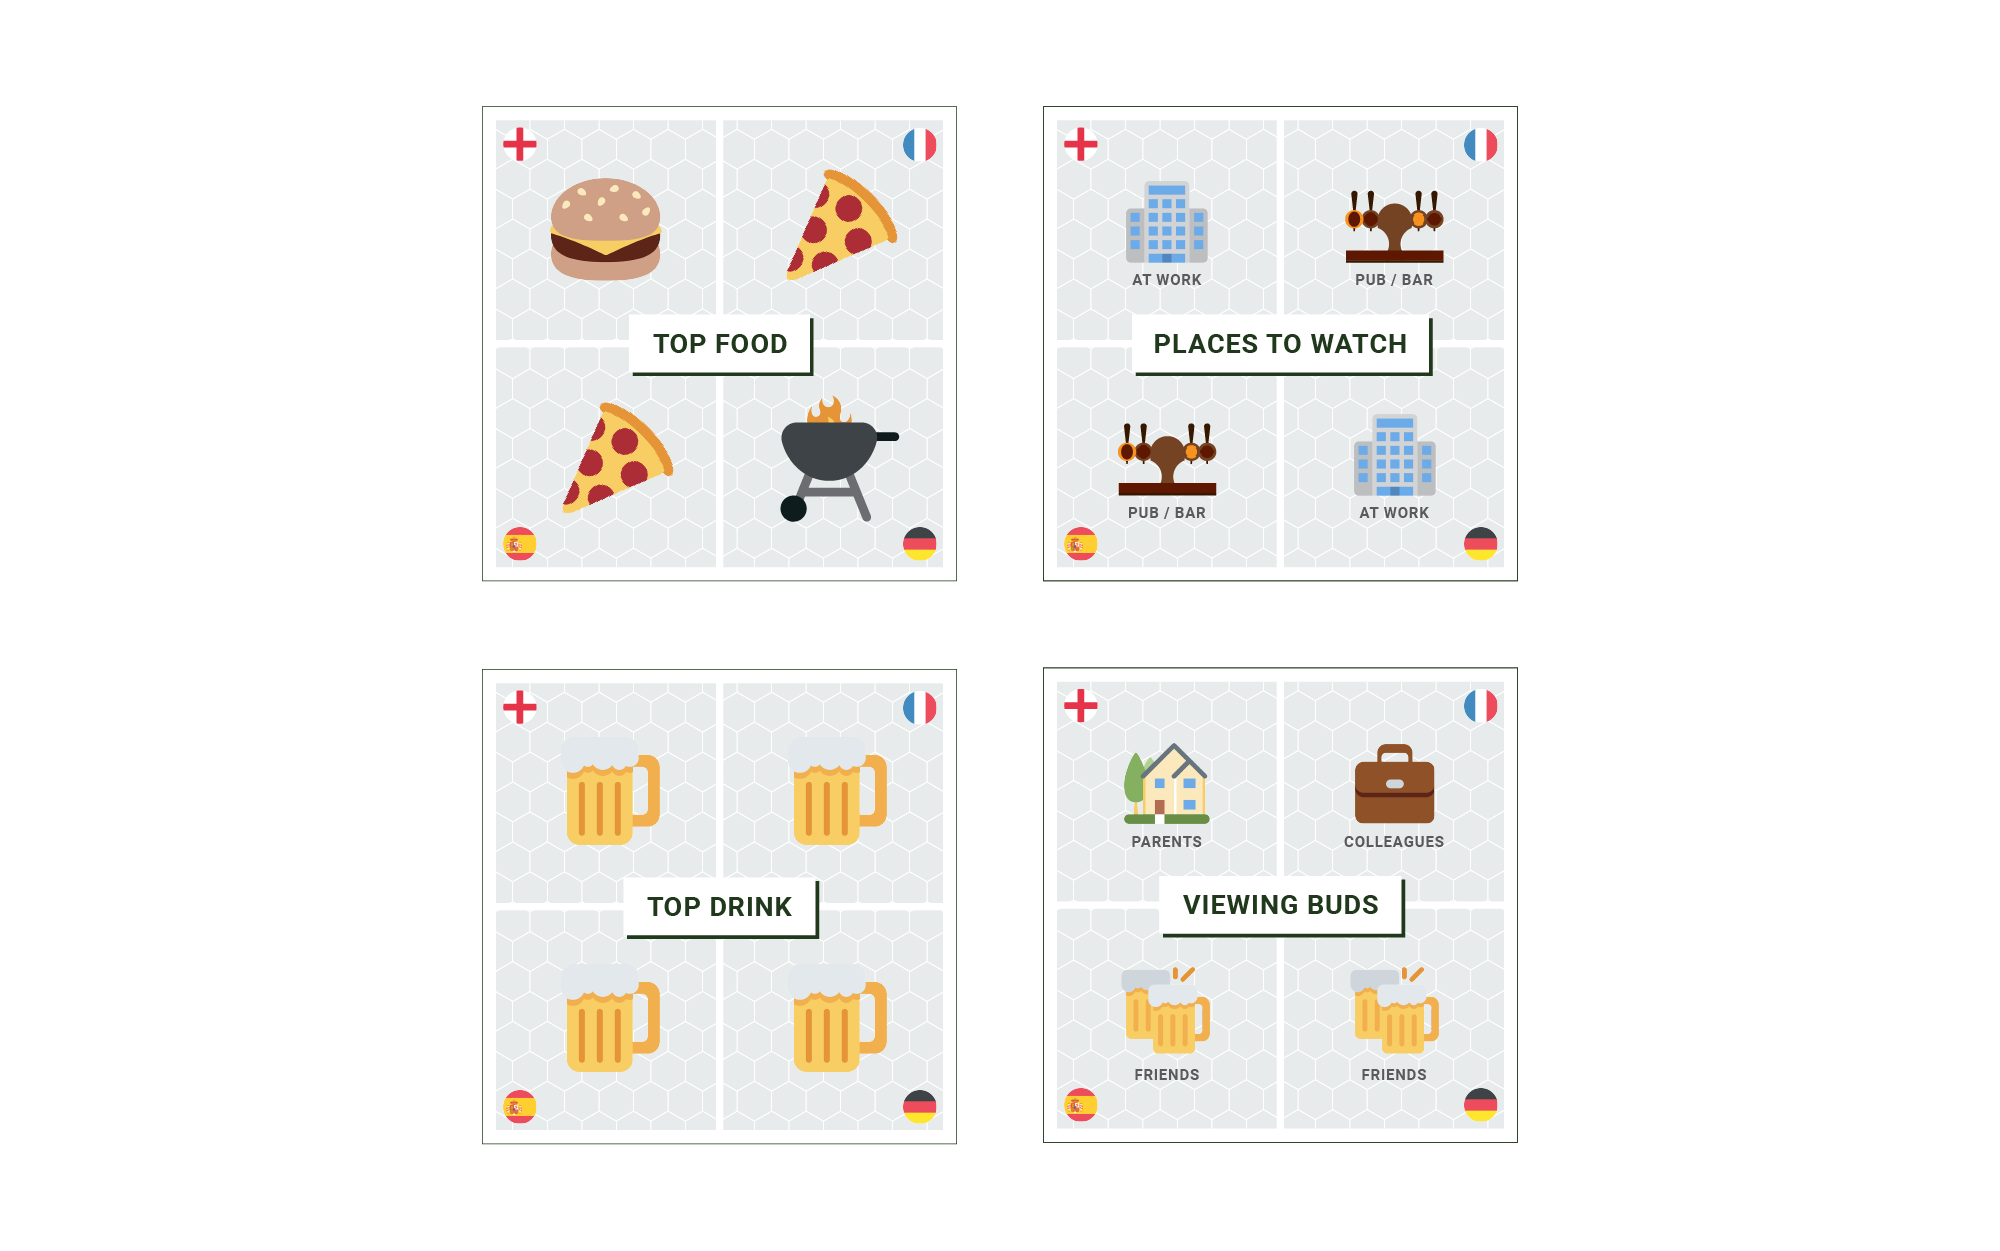
Alongside the match infographics we also utilised our new image recognition technology to analyse sponsorship visibility - a close contest between Adidas and Nike holding 12 teams each. Following on with the style I produced visual assets for the report looking into where fans watched the games and what food they consumed.
These gained great social and media coverage with several publications writing articles utilising the infographics across the different regions.